| Curves Format |
| Customizing Color, Symbol, Extra Symbol, and Line Style |
| Additional Formatting Options |
| Quick Styles |
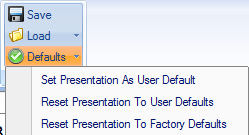
| Saving and Resetting Presentation Selections |
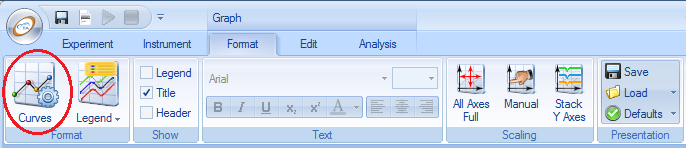
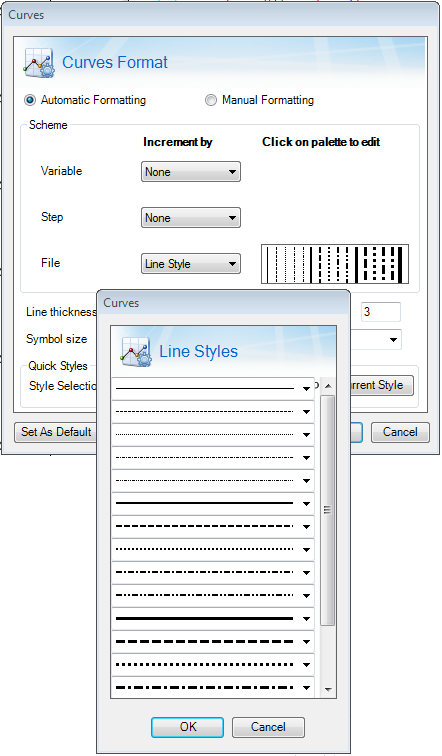
Use the functions in the Curves Format dialog box (which is available from the Curves button located in the Format tab > Format toolbar) to customize the visual properties associated with the graph. The Curves Format dialog box can also be accessed by right-clicking on a curve in the graph and selecting Curves Format...
Customization of curves on the graph is performed by selecting either the Automatic Formatting or Manual Formatting options. The main difference between the two is that in Automatic Formatting, the increments are linked to the file, step and/or variable, whereas in Manual Formatting, increments are applied per curve. The functionality available for customization depends upon the option selected.
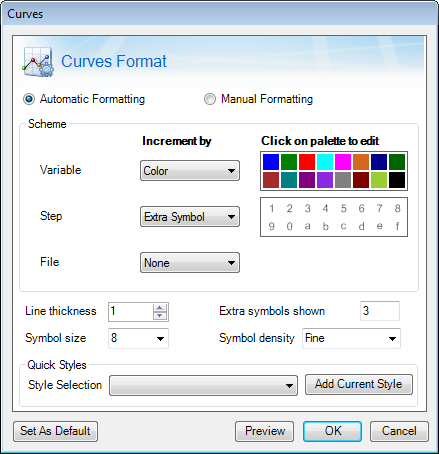
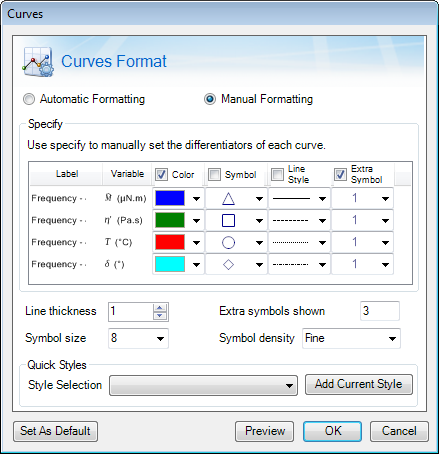
After selecting your desired increments, customize the selections using the palette (when Automatic Formatting is selected) or setting the differentiators (when Manual Formatting is selected).
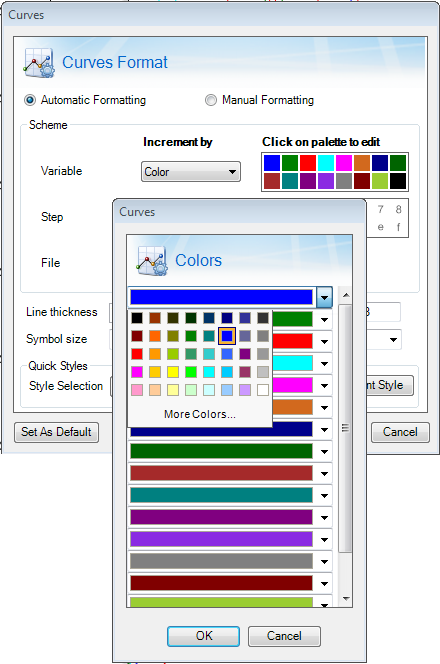
If Color is chosen as an increment for the variable, step, and/or file, then the color palette becomes available. Click the color palette to modify the colors to be used for the curves. In the Colors dialog box, selecting the drop-down arrow for each color allows you to change that specific color.
Note that the order of the colors in the palette are applied to the variables/steps/files in the order in which you add them to the graph. To lock the color of a specific curve so that it is not modified when you make a change to the graph, use the Manual Formatting option.
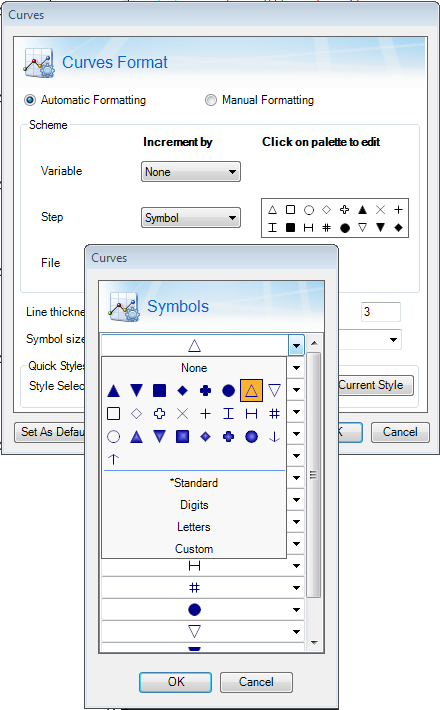
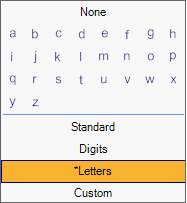
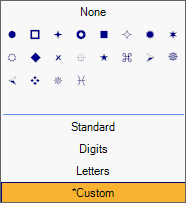
If Symbol or Extra Symbol is selected as an increment for the variable, step, and/or file, then the symbol palette becomes available. Click the symbol palette to modify the symbols to be used for the curves. In the Symbols (or Extra Symbols) dialog box, selecting the drop-down arrow for each symbol allows you to change that symbol.
Note that the order of the symbols in the palette are applied to the variables/steps/files in the order in which you add them to the graph. To lock the symbol of a specific curve so that it is not modified when you make a change to the graph, use the Manual Formatting option.
For information on setting the symbol size, density, or adding extra symbols, see Additional Formatting Options.
Additional Options:
If Line Style is selected as an increment for the variable, step, and/or file, then the line style palette becomes available. Click the line style palette to modify the line style to be used for the curves. In the Line Styles dialog box, selecting the drop-down arrow for each line allows you to change that line style.
Note that the order of the lines in the palette are applied to the variables/steps/files in the order in which you add them to the graph. To lock the line style of a specific curve so that it is not modified when you make a change to the graph, use the Manual Formatting option.
For information on setting the line thickness, see Additional Formatting Options.
These options are available in both Automatic Formatting and Manual Formatting.
Click Preview to view your changes before committing to them. Click OK to set your selections.
You can set the Style Selection so that you can easily and quickly apply previously defined formatting to your curves.